Docker Monitoring with Prometheus & Grafana
- Aastha Thakker
- 21 minutes ago
- 8 min read


When Docker is running, what is it actually doing?
Running a few Docker containers is easy. The more useful question comes after that. How do you know what those containers are doing when you are not staring at the terminal? A container can be alive and still be consuming too much CPU, using more memory than expected, or quietly generating network and disk activity.
This is where Docker monitoring becomes useful.
In this setup, cAdvisor monitors container-level metrics, Node Exporter keeps an eye on the host machine, Prometheus collects and stores those metrics, and Grafana turns the raw numbers into dashboards that are much easier to understand. You can also use Grafana and Prometheus to set up alerts when something crosses a threshold you care about.
So instead of manually checking containers with commands every few minutes, you get a proper Docker monitoring stack that gives you visibility into both your containers and the underlying host.
If Docker itself is still new to you, I’d recommend starting with my earlier post, Docker Tales. It covers Docker images, containers, Docker Engine, Docker Compose, volumes, networking, and the basic Docker architecture before getting into monitoring.
Why monitor Docker at all?
The terminal tells you whether a container is running. Monitoring tells you what that container has been doing over time. That difference matters when troubleshooting.
CPU: spot a container that suddenly starts consuming a large share of processing time.
Memory: see whether usage is stable or steadily increasing.
Disk and filesystem activity: notice unusual reads, writes or storage pressure.
Network: see whether traffic changes when an application becomes busy.
Availability: detect when a service or exporter stops reporting.
History: compare a problem now with what the system was doing a few minutes earlier.
The four monitoring pieces, without the jargon overload
1. cAdvisor: the container view
cAdvisor (Container Advisor) is the part that focuses on containers. It exposes container-level resource statistics such as CPU usage, memory usage, filesystem activity, network traffic and process-related data. Its Prometheus endpoint is /metrics, which makes it straightforward for Prometheus to scrape. The important distinction is this, cAdvisor answers questions like ‘How much memory is this container using?’ rather than only ‘Is the Docker service running?’
2. Node Exporter: the host view
Node Exporter is aimed at the Linux host itself. It exposes hardware- and kernel-related metrics, including CPU, memory, filesystem and network statistics. By default it listens on port 9100. So if cAdvisor tells you that a container is using resources, Node Exporter helps answer the next question: what is happening on the machine hosting those containers?
3. Prometheus: the collector and time-series store
Prometheus collects what these expose. A scrape job tells Prometheus which target to contact and how often to collect metrics. The collected samples are stored as time series and can be queried using PromQL.
In this practical setup, the scrape interval was 15 seconds. That means Prometheus checks the configured targets roughly every 15 seconds, subject to scrape timing and target availability.
4. Grafana: the visual layer
Grafana sits on top of the data source. It does not need to collect the Docker metrics itself. Instead, it connects to Prometheus, runs queries, and displays the results as panels such as time-series graphs, gauges and tables. It can also evaluate alert rules and send notifications.
Setting up the monitoring stack
Prerequisites
Before setting up the monitoring stack, make sure you have:
Docker installed and working on your system.
One or more Docker containers running, so there is some container activity and metrics to monitor.
Docker Compose installed for managing the monitoring services together.
You can verify Docker Compose with:
docker compose versionIf it is not installed and you are using an older Ubuntu/Debian setup, you may see instructions such as:
sudo apt install docker composeReference guidance: Install Docker Compose.
Step 1: Setting up config files
Create two files; prometheus.yml & docker-compose.yml. docker-compose.yml defines three services: Prometheus (the metrics server, port 9090), cAdvisor (collects per-container metrics, port 8080), and Node Exporter (collects host-level metrics, port 9100), along with a volume for persisting Prometheus data.

`image` tells Docker which image to run.
`ports` maps a host port to a container port. For example, `9090:9090` makes Prometheus reachable from the host on port 9090.
`volumes` maps files or persistent storage into containers.
`prometheus_data` gives Prometheus a persistent storage location.

`scrape_interval: 15s` sets the default collection frequency.
Each `job_name` creates a named scrape job.
`static_configs` supplies the target addresses.
Inside a Compose network, service names such as `cadvisor` and `node-exporter` can be used as hostnames because Compose provides service-to-service networking.
Step 2: Checking the stack
sudo docker compose up -d

# List running containers
sudo docker ps
Step 3: Connecting Grafana to Prometheus
In Grafana (localhost:3000), Prometheus was added as a data source using the internal URL http://prometheus:9090, allowing Grafana to query the metrics Prometheus collects. Check the guide link for more details.

This is different from opening Prometheus in your browser with `http://localhost:9090`. `localhost` means the machine from which the request originates. Inside the Grafana container, `localhost` would mean the Grafana container itself, not the Prometheus container. The Compose service name `prometheus` resolves to the Prometheus service.

Step 4: Importing a Monitoring Dashboard
A pre-built community dashboard was imported from Grafana.com and linked to the Prometheus data source, to visualize container and host metrics without building panels manually, as per the guide.

For this setup, I used Grafana community dashboard IDs 16310, 21743 and 17041 for Docker/container and host-level monitoring.


In this step you will integrate 3 pre-built dashboards.
Step 5: Create Custom dashboards using PromQL query.
Now, don’t be scared and don’t think of skipping this task.
Now let’s build a custom Grafana dashboard with four panels that show what is happening inside your Docker environment and on the host machine. The dashboard should include Docker CPU Usage, showing the CPU usage of individual containers such as cAdvisor, Grafana, Node Exporter and Prometheus; Container Memory Usage, showing memory consumption for each container over time; Host CPU Usage, showing the overall CPU usage of the machine running Docker; and Host Memory Usage, showing the overall memory consumption of the host. Make sure the usage values are displayed as percentages (%), so the dashboard is easy to read at a glance.
Your final dashboard should look something like the example shown below and display live data coming through the complete monitoring pipeline: cAdvisor and Node Exporter → Prometheus → Grafana. The purpose of this task is to get used to Grafana UI and PromQL queries. You are free to use GPT or Gemini to generate query but make sure you understand what it does, basic syntax and which parameter it uses and why.

Okay, here are the queries for your idea.
# Docker CPU Usage
100 * sum by (name) (
 rate(container_cpu_usage_seconds_total{name!=""}[1m])
)

# Container Memory Usage
sum by (name) (
 container_memory_usage_bytes{name!=""}
)

# Host CPU Usage
100 * (
 1 - avg(rate(node_cpu_seconds_total{mode="idle"}[1m]))
)

# Host Memory Usage
100 * (
 1 - (
  node_memory_MemAvailable_bytes
  /
  node_memory_MemTotal_bytes
 )
)
Dashboards are useful. Alerts are what make monitoring useful when you are away.
A dashboard needs someone to look at it. An alert can watch a condition and notify you when it matters. In real life, this is what makes sense, just like we manage alerts in SOC, these are the alerts for docker containers or host machine
The basic flow is; choose the Prometheus data source, write or select a PromQL query, define the threshold, configure the contact point, and test the notification. Current Grafana documentation supports this Prometheus-backed alerting workflow.
A) Host CPU Utilization above 60%

The important part is not the exact button sequence but the logic: a metric is queried, the result is compared with a threshold, and Grafana evaluates that rule on its configured schedule. So select ‘is more than’ and value 60%.
The notification contact point used here is webhook.

This would be the normal graph you will see.

Once the CPU usage goes above 60%, webhook notification will be triggered. (Get API of webhook from webhook.site)
For testing, I used stress-ng to temporarily increase CPU utilization. Keep the load conservative, especially if you are working inside a small VM.
stress-ng --cpu 4 --cpu-load 70 - - timeout 40s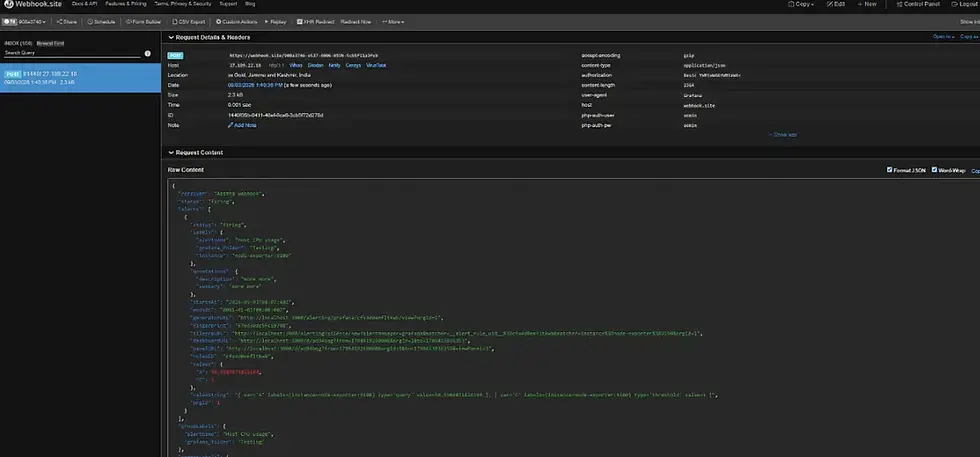

B) Node Exporter Down
In this case, we will configure an email alert for Node Exporter going down. To set this up, we first need to make a few changes to the docker-compose.yml file so Grafana can use an SMTP server to send email notifications. For Gmail, you should enable 2-Step Verification (2FA) on the Google account you want to use for sending alerts. After that, create a dedicated App Password for Grafana. You can think of this as a separate password that allows Grafana to authenticate with Gmail without exposing your actual Gmail password. Edit the given section.
grafana:
  image: grafana/grafana:latest
  container_name: grafana
  ports:
    - 3000:3000
  volumes:
    - grafana_data:/var/lib/grafana
  environment:
    - GF_SECURITY_ADMIN_PASSWORD=admin
    - GF_SMTP_ENABLED=true
    - GF_SMTP_HOST=smtp.gmail.com:587
    - GF_SMTP_USER=yourgmail@gmail.com
    - GF_SMTP_PASSWORD=YOUR_APP_PASSWORD
    - GF_SMTP_FROM_ADDRESS=yourgmail@gmail.com
    - GF_SMTP_FROM_NAME=Grafana
    - GF_SMTP_STARTTLS_POLICY=MandatoryStartTLS

# YOUR_APP_PASSWORD should be a Gmail App Password, not your normal Gmail password.
Go in Prometheus and type “up{job=”node-exporter”}”
(1) Node Exporter is reachable and Prometheus successfully scraped it (Normal)
(0) Prometheus tried to scrape Node Exporter but failed (Down)

Now, you have to update the contact point, i.e the mail of the person who will be receiving alerts from the account you added in the config file.
A contact point tells Grafana where to send an alert.

Once you add this, test if it is working or not.

The test notification is important because an alert rule can be perfectly correct while the delivery configuration is wrong.
# To stop node exporter
docker stop node-exporter

# To start node exporter
docker start node-exporter
You will receive an email like this. Firing = the alert condition is currently true.

Once you start node-exporter, it will show resolved. Resolved = the condition is no longer true and the alert has returned to normal.

Part that usually takes the most time: troubleshooting
The practical was not a perfectly straight line from command one to dashboard. That is actually useful, because monitoring setups teach you a lot when something breaks.
Problems I faced and how I solved them:
Prometheus exited: check `docker compose ps` and then `docker compose logs prometheus` before restarting it.
No data in Grafana: first test the Prometheus data source, then check whether the target is up in Prometheus.
Wrong hostname: from Grafana, use the Compose service name `prometheus`, not `localhost`.
No host metrics: check Node Exporter and confirm that Prometheus can scrape `node-exporter:9100`.
No container metrics: check cAdvisor and its `/metrics` endpoint.
Alert test works but real alerts do not: check the query, threshold, evaluation/pending settings and contact point.
# Useful checks
docker compose ps
docker compose logs prometheus
docker compose logs cadvisor
docker compose logs node-exporter
Few security details worth keeping in mind
Monitoring exposes information about the machine. CPU and memory graphs may look harmless, but metrics endpoints can reveal container names, filesystem information, network details and service behavior. Treat them as infrastructure interfaces, not public web pages.
Do not expose Prometheus, Grafana, cAdvisor or Node Exporter to the public internet without a deliberate security design.
Protect Grafana accounts and use appropriate permissions.
Be careful when binding Docker daemon metrics to `0.0.0.0`; only expose what you actually need.
Keep images and monitoring components updated, especially when using floating tags such as `latest`.
Use persistent storage deliberately for Prometheus and back up what you actually need.
Once this flow makes sense, the individual commands stop feeling like a list to memorize. You are building a small monitoring pipeline: exporters expose measurements, Prometheus collects them, and Grafana gives those measurements a usable interface.
Continue reading
More cloud-related posts: Cloud Computing, my cloud-computing section with AWS and related practical posts.
Documentation used while setting this up:



Comments